
Reports in Salesforce are essential because they help transform raw data into actionable insights. At their core, reports provide a structured way to understand trends, performance, and key metrics within the system.
For example, a sales team can easily track their pipeline and monitor how close they are to meeting quarterly goals. By seeing data in this organized way, teams can make informed decisions that drive business growth.
Reports can be customized to suit different needs, allowing users to filter and group data to focus on specific aspects of their business. Whether it’s analyzing sales by region, the performance of individual team members, or customer support case resolutions, Salesforce’s report flexibility ensures that stakeholders get the information that matters most to them.
Why is Measuring Report Usage So Important?
Measuring report usage in Salesforce is crucial to understanding how effectively teams are using data to make decisions.
By tracking report usage, you can see which reports are accessed most frequently and which ones are being ignored. This helps identify which reports are valuable to the team and which may need refinement or removal.
If a critical sales pipeline report is rarely used, it may indicate that the report isn’t providing the right information or isn’t user-friendly. By measuring usage, organizations can ensure that the time and effort spent creating reports results in meaningful insights.
Creating a Report with the “Last Run” Field
Currently, Salesforce does not offer a built-in feature to track the number of times a report is run, but this has been suggested as an idea. You can follow the status of this idea here.
However, there’s a simple workaround: you can generate a report on existing reports by creating a new report and including the “Last Run” field as a column. This allows you to filter reports based on when they were last run.
To do this:
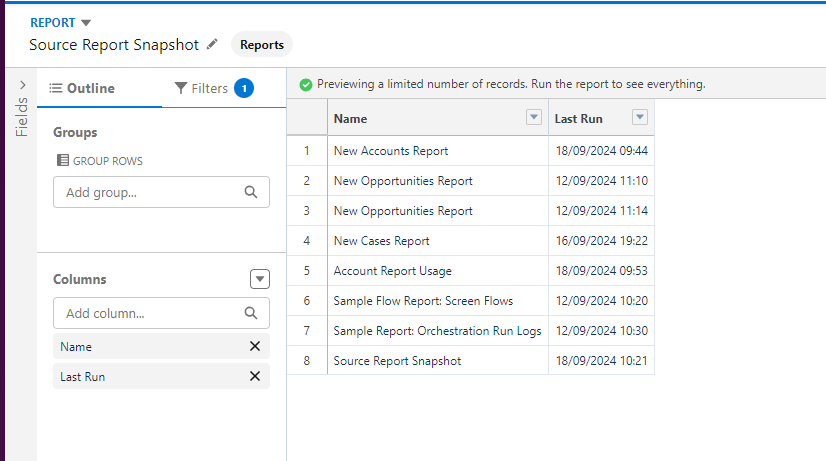
- Create a new report named “Source Report Snapshot” and select the standard report type “Reports”;
- Add the “Last Run” and “Name” fields to the report.
Using Report Snapshot to View Historical Data
But here’s the problem: how can we track report usage over time if this only shows the last time the report was run?
The answer is Report Snapshots.
With this Salesforce feature, you can create reports with historical data. To do this, you’ll need to create a custom object to store this data and then generate reports based on this new object.
Here’s how it works:
- Create a custom object to store the information:
- Name it “Report Snapshot”;
- Remember to check the “Allow Reports” option in the “Optional Features” section;
- Create the fields: “Last Run” (Date/Time) and “Report Name” (Text).
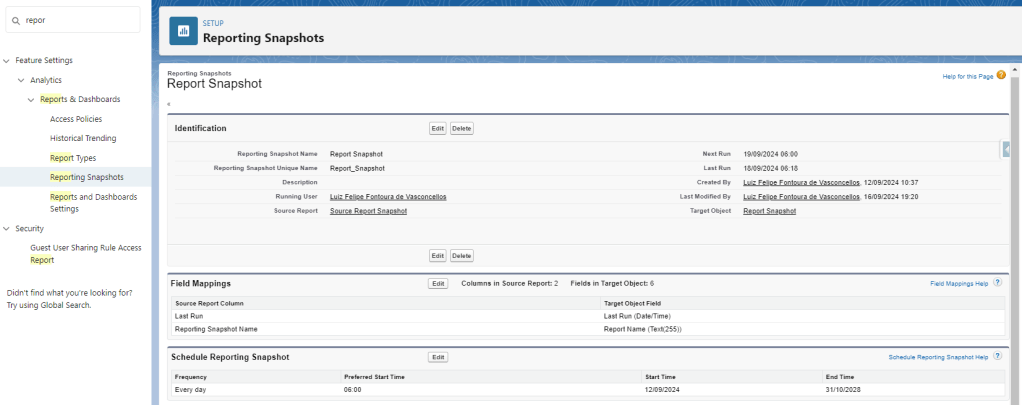
- Go to Setup > Reporting Snapshot > New Reporting Snapshot:
- Give your snapshot a name;
- Select a “Running User” – the automation will run under this user;
- Choose the “Source Report Snapshot” – the report you created earlier;
- Choose the “Report Snapshot” object.
- To configure the Report Snapshot:
- Go to Setup > Reporting Snapshot > Click on the name of the snapshot you just created;
- In “Field Mappings”, click “Edit” and map the “Last Run” and “Report Name” fields, then click Save;
- In “Schedule Reporting Snapshot”, click “Edit”, set the frequency to “Daily”, choose start and end dates, and click Save.
Creating Reports Based on Report Snapshots
Now that everything is set up, you’ll need to wait for the automation to run for a few days to start seeing results. After that, you can create a report using the “Report Snapshot” report type – the object we created to store information over time.
Example:
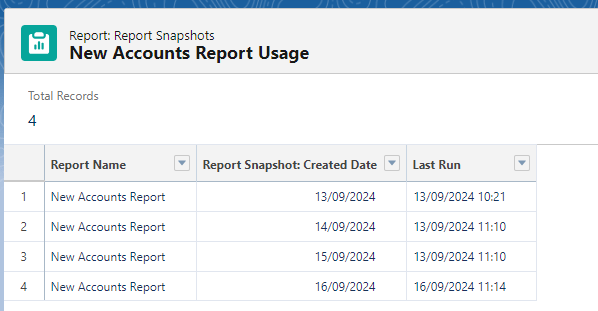
Let’s say you have a report called “New Accounts Report”.
- Create a report called “New Accounts Report Usage” using the “Report Snapshot” report type;
- Add the following fields to the report:
- “Report Name”;
- “Last Run”;
- “Created Date”;
- Add a filter where “Report Name” equals “New Accounts Report”.
How to Interpret the Data?
Looking at this report, suppose you see that between September 13th and 15th, snapshot records were created, but the “Last Run” field remains the same for all three days.
This means that between September 14th and 15th, the report was not used.
There are other ways to analyze this data. For example, you can create dashboards based on these reports. The key takeaway is to understand when a report was last run.
COMMENTS:

Leave a comment